API
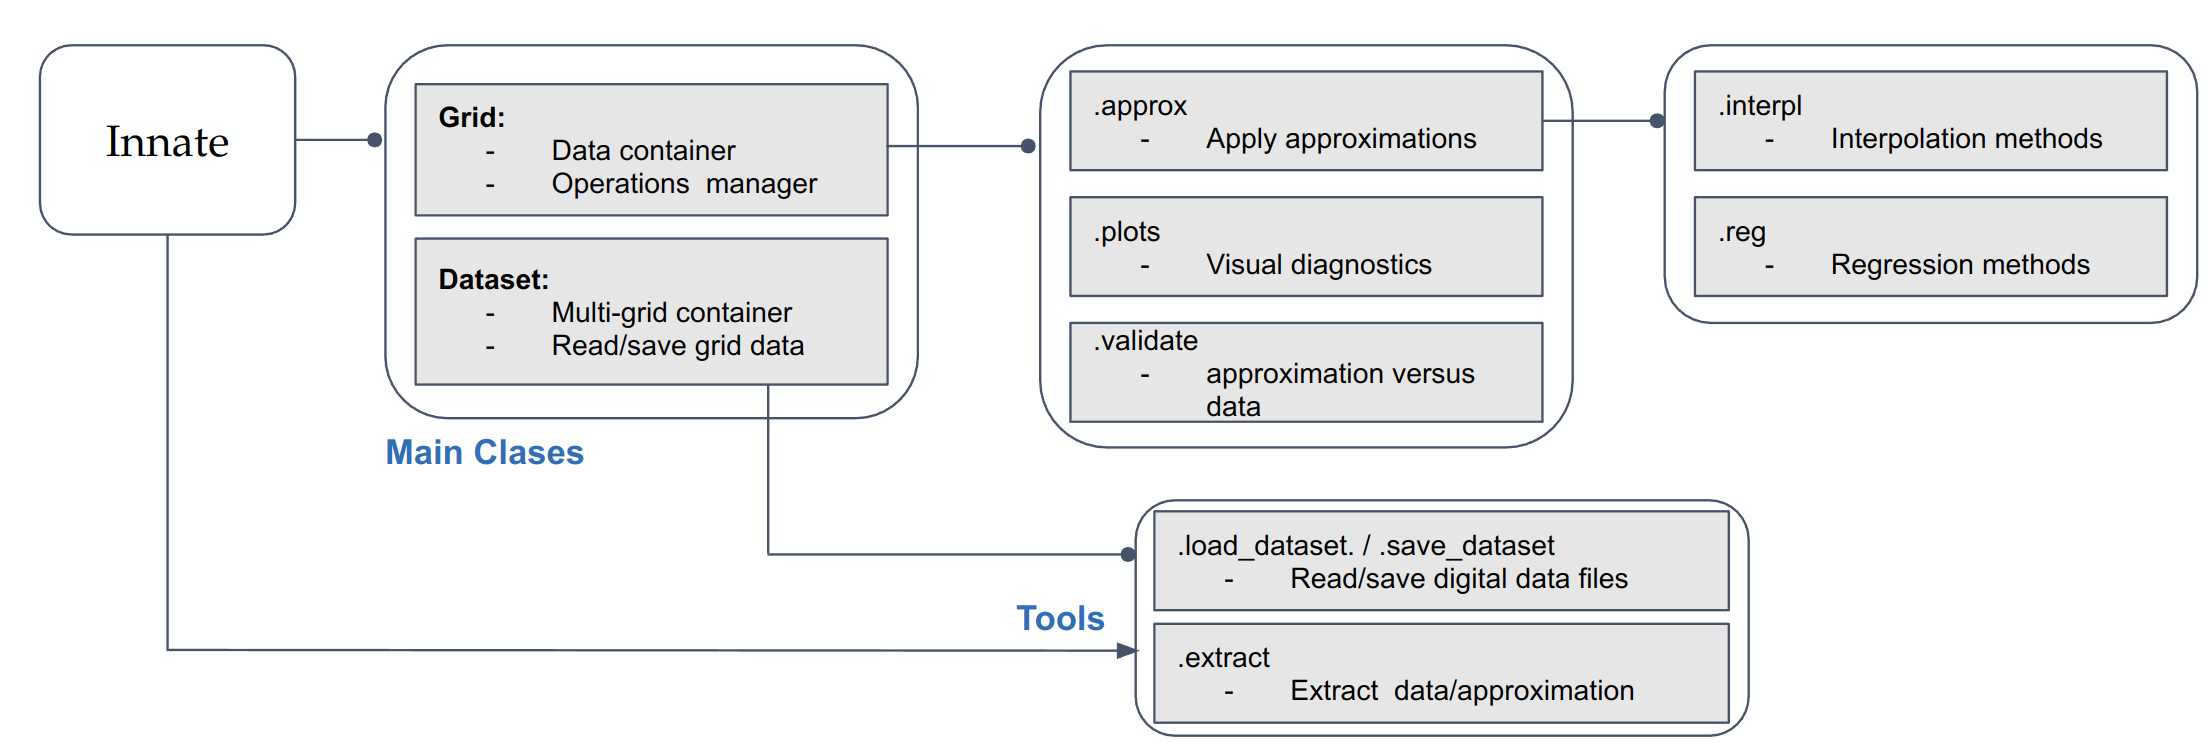
 features a composite software design, utilizing instances of other classes to implement the target
functionality. The image below shows a basic diagram with the library structure:
features a composite software design, utilizing instances of other classes to implement the target
functionality. The image below shows a basic diagram with the library structure:
The next sections detail the functions attributes and their outputs:
Inputs/outputs
- innate.io.load_dataset(fname: str)[source]
Load the data grids and configuration from a digital file.
Parameters
- fnamestr
The file address or path of the file.
Returns
- A dictionary with the data arrays, a dictionary with the global grids configuration and a dictionary with the local grid configuration.
For ‘.fits’ files: (array_dict, common_cfg, local_cfg)
For ‘.nc’ files: (array_dict, common_cfg, local_cfg)
Raises
- InnateError
If no dataset file is found at the specified location.
- KeyError
If the file extension is not recognized.
Notes
This function checks the file extension and loads the dataset using the appropriate method: - ‘.fits’ files are loaded using fits_file_load. - ‘.nc’ files are loaded using h5netcdf_file_load.
Examples
>>> data = load_dataset('data/file.fits')
>>> data = load_dataset('data/file.nc')
- innate.io.save_dataset(fname: str, grid_dict: dict, common_cfg: dict, custom_cfg: dict)[source]
Save the data grids and configuration to a digital file.
Parameters
- fnamestr or pathlib.Path
The name of the file where the dataset will be saved.
- grid_dictdict
Dictionary containing the data grid to be saved.
- common_cfgdict
Dictionary containing common configuration parameters.
- custom_cfgdict
Dictionary containing custom configuration parameters.
Returns
None
Raises
- KeyError
If the file extension is not recognized.
Notes
This function checks the file extension and saves the dataset using the appropriate method: - ‘.fits’ files are saved using fits_file_save. - ‘.nc’ files are saved using h5netcdf_file_save.
Examples
>>> save_dataset('data/output.fits', grid_dict, common_cfg, custom_cfg)
>>> save_dataset('data/output.nc', grid_dict, common_cfg, custom_cfg)
Core objects
- class innate.Grid(grid_label, data_array, data_cfg, tensor_library='pytensor')[source]
A class used to represent an innate Grid, which consits in a (numpy) data array and a set of configuration entries.
In the case of interpolation techniques the user can specify the tensor library, which is used to compile the approximations.
Parameters
- grid_labelstr
The label for the grid.
- data_arrayarray-like
The data array.
- data_cfgdict
Configuration dictionary for the data, containing the array dimensions information.
- tensor_librarystr, optional
The tensor library to use (default is ‘pytensor’).
Attributes
- labelstr
The label for the grid.
- descriptionstr
Description of the data parameter.
- dataarray-like
The data array.
- axeslist
List of axes for the data.
- shapetuple
Shape of the data array.
- axes_rangelist
Range of the axes for the data.
- approxApproximator
An approximator instance for handling data approximations.
- plotPlotter
A plotter instance for visualizing the data.
Methods
- reconstruct_axes_range(grid_label, axes, data_cfg, shape)
Reconstructs the range of axes for the grid.
- class innate.DataSet(array_dict, common_cfg, local_cfg, **kwargs)[source]
A class used to represent a Dataset, inheriting from Python’s built-in dictionary.
This class is initialized with data arrays and configuration parameters, and it unpacks these into the class dictionary.
Parameters
- array_dictdict
Dictionary containing data arrays.
- common_cfgdict
Dictionary containing common configuration parameters.
- local_cfgdict
Dictionary containing local configuration parameters.
Attributes
- data_labelsNone or list
Placeholder for data labels. Initialized as None.
- shape_arrayNone or tuple
Placeholder for the shape of the data arrays. Initialized as None.
- innate.DataSet.from_file(fname, grid_cfg=None)
Creates a DataSet dictionarly-like object from an input file address.
Parameters
- fnamestr
The file address or path of the file containing the dataset.
- grid_cfgdict, optional
- Configuration parameters for the dataset provided by the user. These values will overwrite common entries on
the fiel configuration parameter. Default is None.
Returns
- DataSet
A DataSet dictionarly-like object containing the scientific arrays, the data configuration and the approximation techniques.
Notes
This method loads and parses the input data from the specified file. It updates the input configuration with the parameters provided by the user.
Examples
>>> scientific_data = DataSet.from_file('data/file.txt', grid_cfg={'param': 'value'})
Interpolation techniques
- innate.interpolation.pytensor.regular_grid_interp(points, values, coords, *, fill_value=None)[source]
Linear interpolation on a regular grid in arbitrary dimensions.
The data must be defined on a filled regular grid, but the spacing may be uneven in any of the dimensions.
Parameters
- pointslist of array-like
A list of vectors with shapes
(m1,), ... (mn,). These define the grid points in each dimension.- valuesarray-like
A tensor defining the values at each point in the grid defined by
points. This must have the shape(m1, ... mn, ..., nout).
Returns
- resultarray-like
Interpolated values at the requested points.
Regression techniques
- innate.regression.methods.parse_string_equation(data_label, str_eqn, coeffs_eqn, variable_names)[source]
Parse a string equation and its coefficients (as float array) to generate its programatic object using numpy.
If the equation or coefficients are not provided, it logs a warning message.
Parameters
- data_labelstr
The label for the data set.
- str_eqnstr or None
The string representation of the equation. Can be None.
- coeffs_eqndict or None
A dictionary containing the coefficients for the equation. Can be None.
- variable_nameslist of str
A list of variable names used in the equation.
Returns
- eqnfunction or None
The generated specific function based on the equation and coefficients. Returns None if the equation or coefficients are missing.
- coeffs_dictdict or None
A dictionary of coefficients extracted from coeffs_eqn. Returns None if the equation or coefficients are missing.
Notes
If the str_eqn or coeffs_eqn is None, a warning message is logged specifying which part is missing from the data set configuration.
Examples
>>> eqn, coeffs_dict = parse_string_equation("example_data", "a*x + b", {"a": 1, "b": 2}, ["x"])
>>> print(eqn)
<function ...>
>>> print(coeffs_dict)
{'a': 1, 'b': 2}
Plots
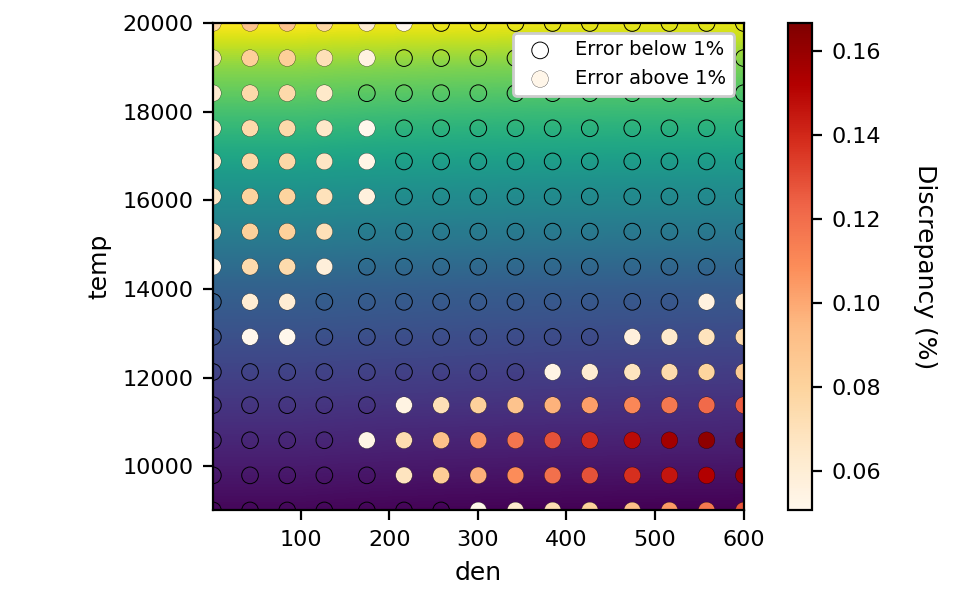
- innate.plotting.Plotter.matrix_diagnostic(self, output_address=None, num_points=15, technique='rgi', in_fig=None, fig_cfg={}, ax_cfg={}, maximize=False)
This function plots the 2D grid array as a surface plot where at even intervals the scatter points color represent the absolute divergence between the array data and the selected approximation.
Parameters
- output_addressstr, optional
The file path to save the output figure. If None, the figure will be displayed on the screen.
- num_pointsint, optional
The number of points per axis to test the discrepancy between the grid data and the approximation. Default is 15.
- techniquestr, optional
The interpolation technique to use. Default is ‘rgi’.
- in_figmatplotlib.figure.Figure, optional
An existing figure to plot on. If None, a new figure will be created.
- fig_cfgdict, optional
Configuration dictionary for the figure settings. Default is an empty dictionary.
- ax_cfgdict, optional
Configuration dictionary for the axes settings. Default is an empty dictionary.
- maximizebool, optional
Whether to maximize the figure window. Default is False.
Returns
- in_figmatplotlib.figure.Figure
The figure object containing the diagnostic plot.
Notes
This function prepares the data by extracting the grid, parameters, and axes ranges. It computes the test points and the discrepancies between the interpolated and actual data values. The results are plotted on a figure, highlighting areas with discrepancies below and above 1%.
Examples
>>> fig = obj.matrix_diagnostic(output_address='output.png', num_points=20, technique='rgi')
>>> plt.show(fig)